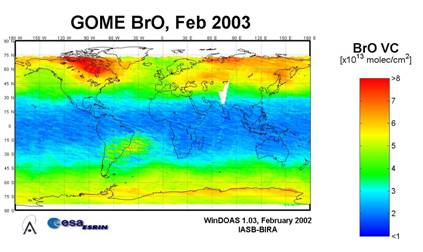
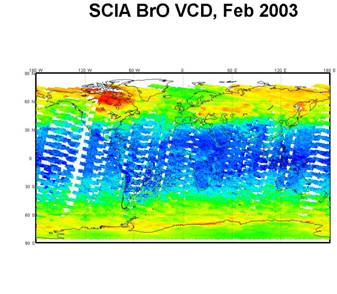
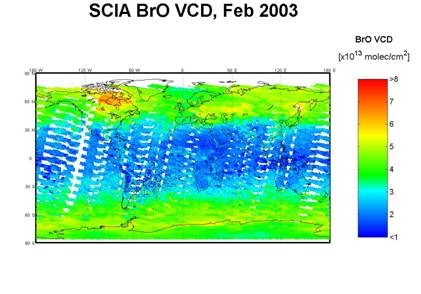
A comparison between BrO vertical columns derived, for the month of February 2003, from GOME and available spectra of SCIAMACHY (neither all days nor a total coverage for each day are available) is presented in Figure 1.
In these plots, GOME values are baseline retrievals in the 344.7-359 nm interval, while SCIAMACHY data have been processed in the UV-shifted window (336-351.5 nm), first using the Wahner BrO cross-sections, second using the Wilmouth cross-sections. Best match with GOME is clearly obtained using the Wahner cross-section. Similarly, good matching with GOME can also be obtained using the Wilmouth cross-sections when these are scaled by 0.83 (see Figure 2).
 |
|
 |
 |
|
Figure 1: Monthly Mean of BrO columns for February 2003 retrieved with GOME (a) and available SCIA spectra, with respectively Wahner (b) and Wilmouth (c) BrO XS
|
|
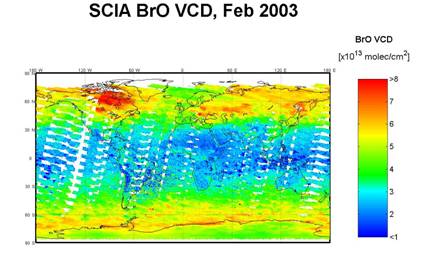 Figure 2: Monthly Mean of BrO columns for February 2003 retrieved available SCIA spectra, with Wilmouth BrO XS divided by the correction factor Figure 2: Monthly Mean of BrO columns for February 2003 retrieved available SCIA spectra, with Wilmouth BrO XS divided by the correction factor |