The BIRA-IASB BrO Product

go to TEMIS Home Page

Tropospheric bromine monoxide (BrO)


Monthly Maps

Composite 3-Days Maps

Daily Maps

Overpasses


Contact

page last modified:
Tue 10 November 2009


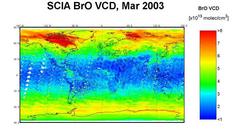
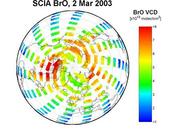
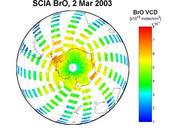
The Total Column Level-3 Product

The total column BrO level-3 Product completes the BrO Level-2 Product with a collection of maps (monthly, composite 3-days and daily maps) in three available projections (Northern hemisphere, Southern hemisphere and global projection) and with time series over pre-defined stations known for carrying on BrO measurements.

Global projection,
Monthly map
Northern Hemisphere,
Composite 3-days map
Southern Hemisphere,
Daily map
GOME
Global projection
Northern hemisphere projection
Souhtern Hemisphere projection
SCIAMACHY
Global projection
Northern hemisphere projection
Southern Hemisphere projection
GOME2
Global projection
Composite 3-days maps not available for GOME2
Southern Hemisphere projection


Last GOME processing: Reprocessing of the whole GOME data set in November 2003. See the GOME BrO retrieval page for further information.
Last SCIAMACHY processing:

Near-real time processing since January 2007.

Last GOME2 processing:

2008 year has been processed in November 2009.

For further information on the DOAS technique used to retrieve the slant columns, see the Algorithm Description Document.
For a better description of the Level-3 product, see the Product Specification Document.

Maps are created from pre-calculated grids (resolution : 0.5° in latitude, 1° in longitude for GOME, 0.5° in latitude, 0.5° in longitude for SCIAMACHY) using add-ons developed in Matlab, a language for technical computing, including high-performance graphics and mapping facilities.
The length of the individual pixels and the sphericity of the earth are taken into account to distribute and weight the BrO Vertical Columns (BrO VCD) in the different graticules of the grid crossed by the pixel.
The colorbar has been adjusted in order to bring the tropospheric BrO to the fore.

Monthly maps are calculated by averaging data over a complete month; composite 3-days maps are calculated by averaging data on periods of 3 days, the minimum period necessary for GOME to achieve global coverage at the equator.

The level3 product is also available through the following links :

Note that a password is requested to reach these pages. Please, contact Caroline FAYT to have it.

Similar products exist at the universities of Bremen and Heidelberg.